Explore Expenses, Revenue and Cost of Revenue
Three pages break one part of your Profit & Loss down by category and by vendor or customer, with what grew, what shrank and the transactions behind it.
Which page shows what
In the left navigation, open Home, then click Expenses, Revenue or Cost of Revenue. All three work the same way on a different part of your Profit & Loss:
| Page | Categories it includes | Third tab |
|---|---|---|
| Expenses | Operating expenses and other expenses | Vendors |
| Revenue | Revenue and other income | Customers |
| Cost of Revenue | Cost of revenue | Suppliers |
The totals come from the same calculation as Financials, so they match your Profit & Loss for the same period.
Each page has three tabs: Overview, Categories and Vendors (or Customers, or Suppliers). Pick the period at the top; see Choosing a reporting period.
Overview: what changed and why
Expenses Over Time (or Revenue Over Time, or Cost of Revenue Over Time) charts the total for each period, with a change chip against the period before.
Did you know? explains the biggest changes in plain sentences, for example which category rose and which vendor caused it. Click the numbered dots to move between them.
Highlights shows three lists of five: Top Categories, Top Vendors (or customers, or suppliers) and Top Transactions. Switch between:
Largest: the biggest amounts this period.
Growing: what rose most compared with the period before.
Shrinking: what fell most.
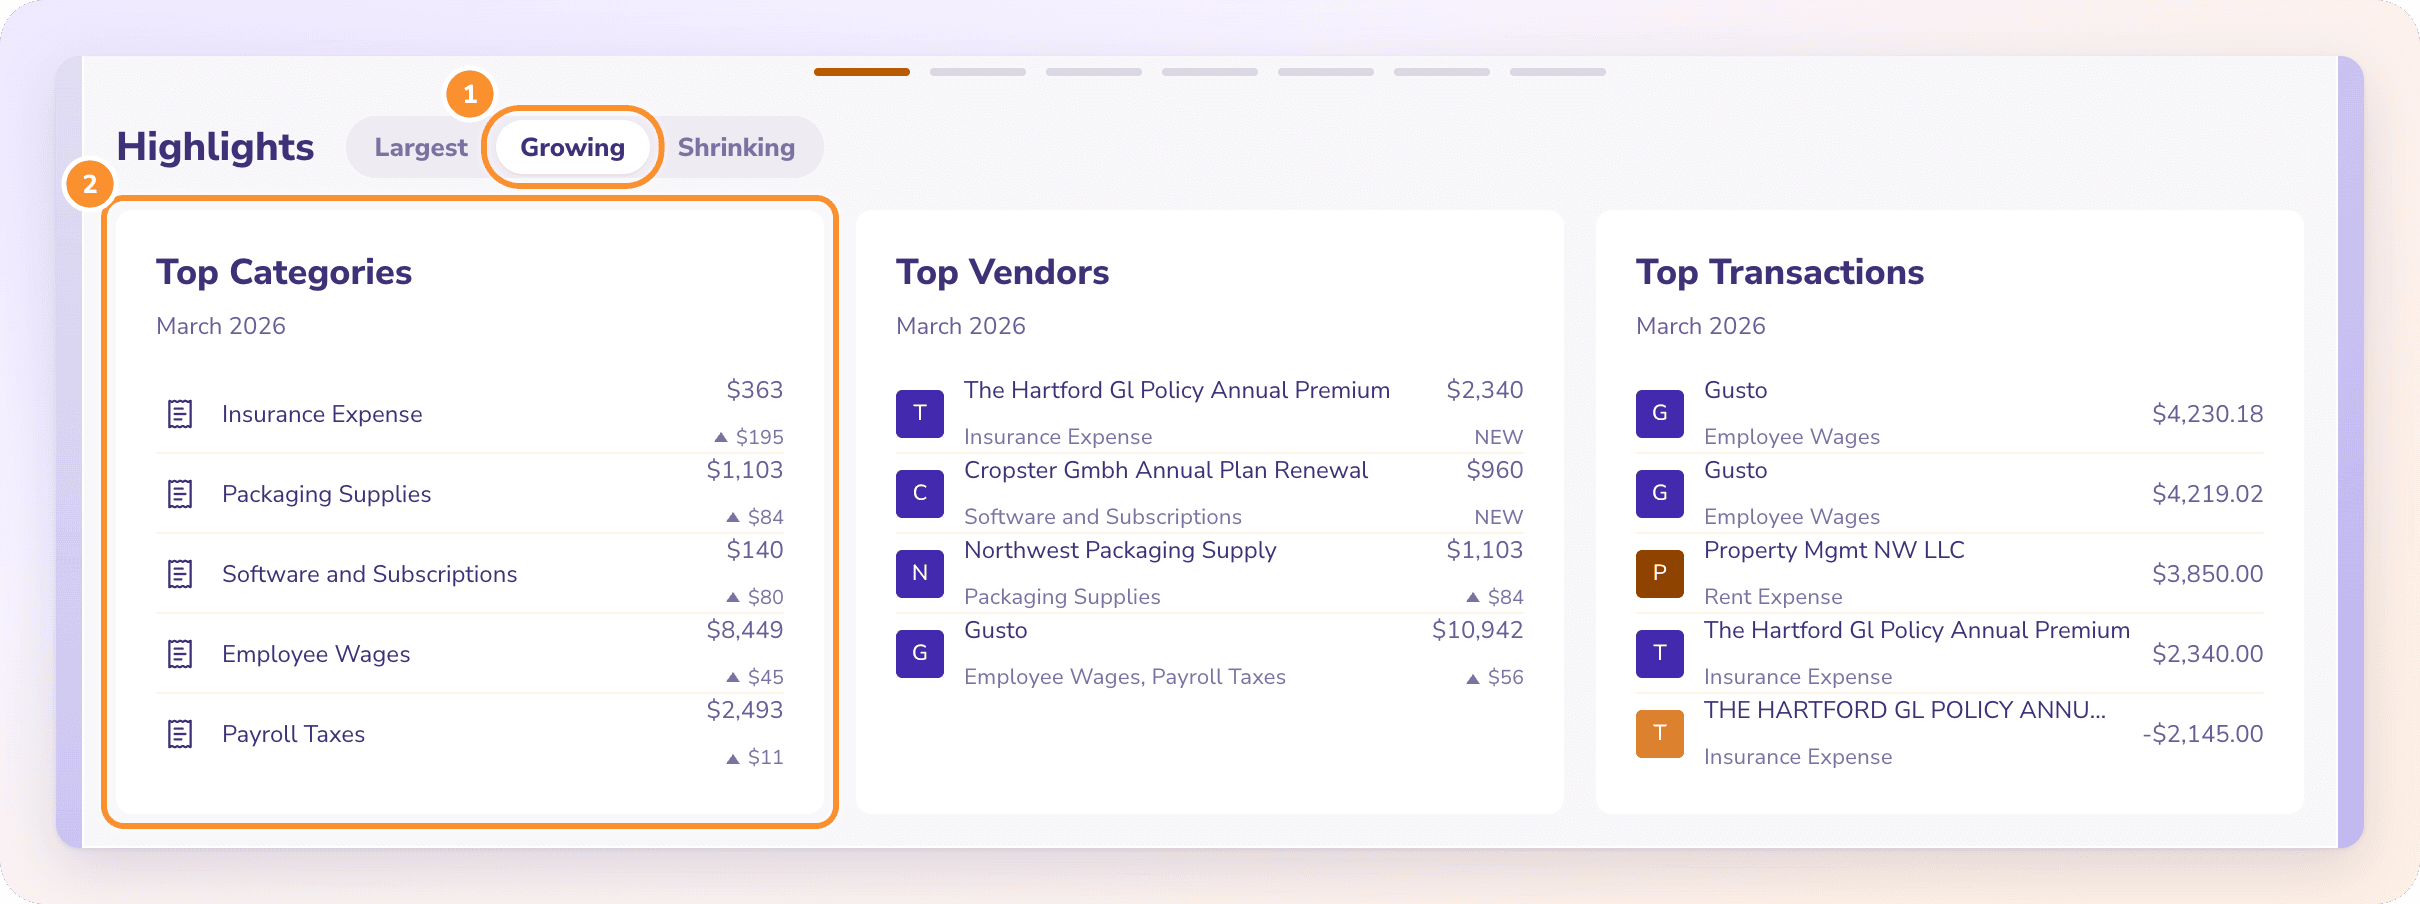
A row marked NEW had nothing in the period before. A – means no change.
Categories and Vendors: the full breakdown
The Categories tab charts your five largest categories and lists every category below it. The Vendors, Customers or Suppliers tab does the same by party.
Type in the search box to find a category. Click Clear search to show them all again.
Switch between Waterfall view and List view.
Click Sort and choose Amount or Name. Click the same option again to reverse the order.
Click the arrow on a parent category to Expand or Collapse its subcategories.
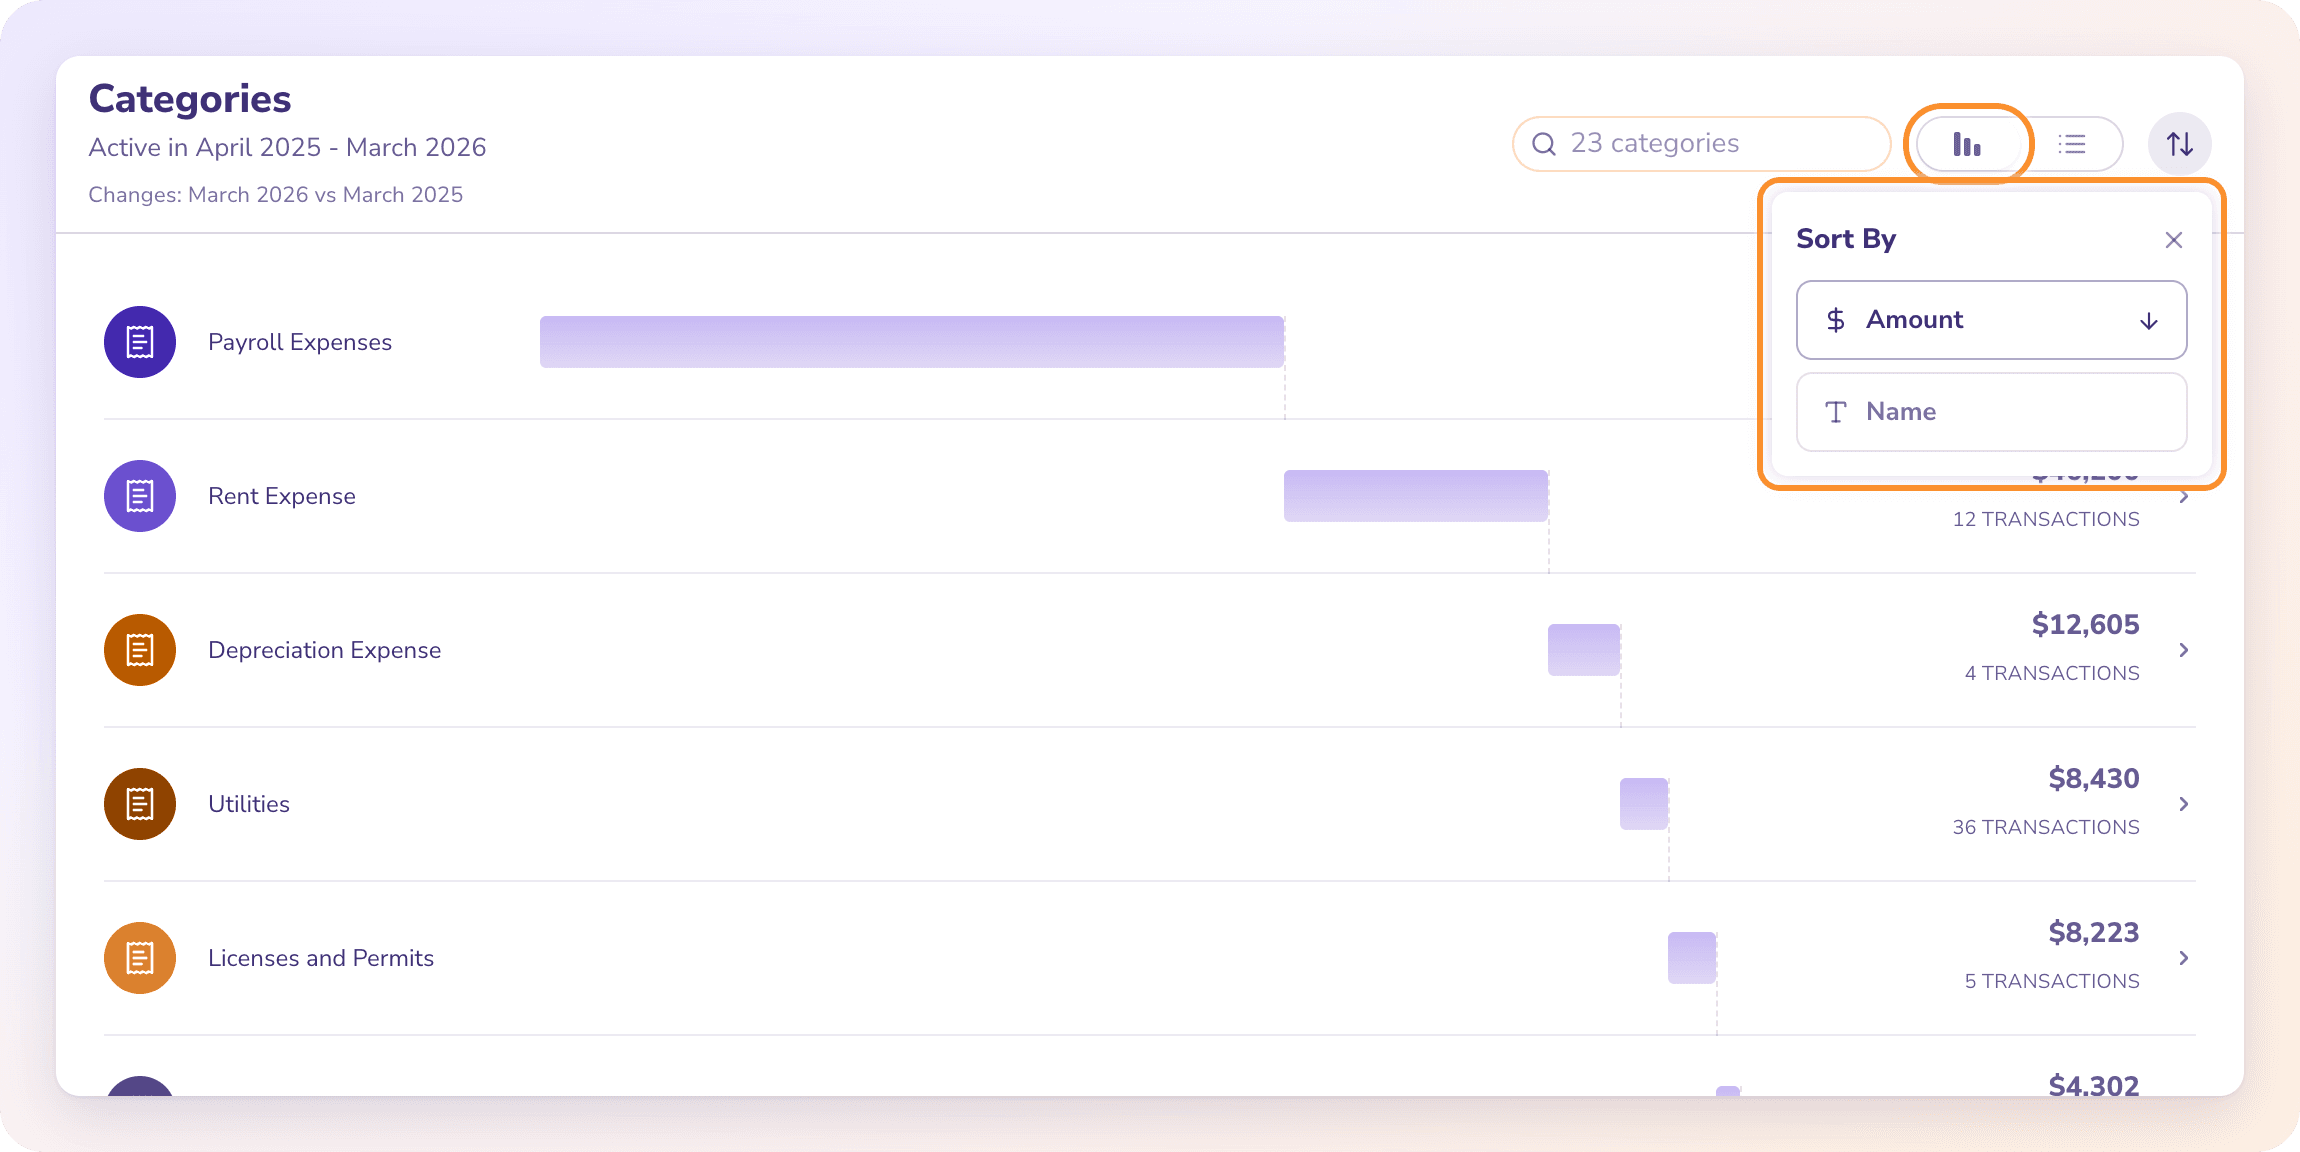
Each row shows a small trend line, the total, the number of transactions and the change. In this list, the change compares with the same period a year earlier, as the line above the list says (for example "Changes: March 2026 vs March 2025"). STABLE means no change from a year earlier, and From $0 means there was nothing a year earlier.
See the transactions behind a category
Click a category row (in either view) to open the Ledger filtered to that category. It covers the whole window shown on the chart, not only the month you picked. See Navigate the Ledger.
Tip: To recategorize everything from one vendor, go to Vendors. Vendor rows on this page are for reading only. See Recategorize a vendor's transactions.
Frequently Asked Questions
Why are Growing and Shrinking greyed out?
There is no earlier period to compare with. This happens with All Time, which has nothing before it. Pick a month, quarter or year instead.
Why is my Expenses page lower than Top Expense Categories on Dashboards?
Because Dashboards includes cost of revenue in Top Expense Categories, and the Expenses page doesn't. Cost of revenue has its own page.
Which accounts appear on the Revenue page?
Categories of type Revenue and Other Income. You can check a category's type in Accounting › Category Manager.
Will the period I pick stay when I come back?
Yes, for this company and page, until you close the browser tab. A new tab starts on the last complete month again.
What does "Detailed activity begins…" mean?
The period you picked is before your books start date. Figures before that date are opening balances, not individual transactions. Pick a period from that date, or click Review opening books.
Can I click a vendor to see its transactions?
No, vendor, customer and supplier rows on these pages aren't clickable. Open the vendor in Vendors or Customers, or click a category row to open the Ledger.
Is the "Did you know?" text written by AI?
No. It's built from your figures with no AI involved, so it always matches the numbers on the page.
Learn more about AI-native general ledger: A double-entry ledger where statements become proven transactions.
Still stuck? A real person reads every message—come say hello.